The Ascending Triangle, Defined
The ascending triangle is a continuation pattern with a flat horizontal resistance line on top and a rising support line below it, the two converging to an apex. Price bounces between them with higher lows until it closes outside one of the trendlines, most often upward.
I treat it as one of the few patterns worth trading on the long side, because the up breakout has a genuinely strong statistical record.
The shape says buyers are willing to pay ever-higher prices on each dip while sellers hold a fixed ceiling. When the ceiling finally gives way, the buyers win.
The catch, and the part most pages bury, is that the same triangle breaking downward is a completely different, much weaker trade.
Anatomy of the Pattern
The pattern has two trendlines and both must behave as described. The top trendline is horizontal, marking a resistance level the price cannot beat.
The bottom trendline slopes upward, marking rising support where buyers step in at higher prices each time.
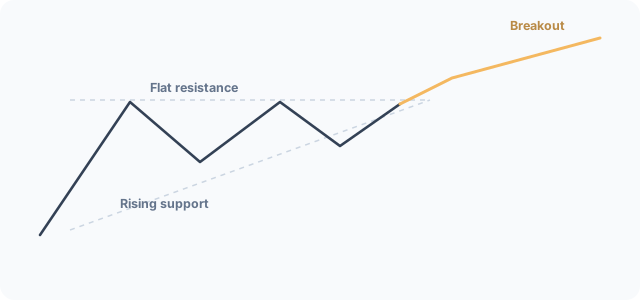
I only count the triangle when it is properly filled.
Bulkowski requires price to cross the pattern from side to side, touching at least three times on one trendline and twice on the other, so the shape is a real narrowing range rather than a couple of random touches. A half-empty triangle with a single peak and a single trough is not a triangle; it is two lines you drew.
Up Breakout vs Down Breakout: Two Different Trades
This is the section I want traders reading before they pick a direction, because the ascending triangle is not one setup but two with opposite odds. The up breakout, a close above the flat resistance, is the strong trade: buyers finally overwhelmed the ceiling and the follow-through tends to run.
The down breakout, a close below the rising support, is the weak one.
Upward breakouts happen more often, about 63% of the time, and they tend to fire well before the apex.
I treat the two breakouts as entirely separate decisions. A long on the up breakout has the statistics on its side; a short on the down breakout is fighting a pattern that breaks down only a third of the time and busts nearly half the time it does.
Direction is the whole edge on this pattern.
The Volume Signature
Volume on an ascending triangle should decline as the pattern tightens, then spike on the breakout. Bulkowski found volume trends downward at least 78% of the time through the formation, which reflects the narrowing range and the indecision before the resolve.
The breakout needs to reverse that quiet.
A valid up breakout lands on a volume surge, because that is the buyer conviction needed to clear the flat ceiling. I cross-check the break against momentum before committing, since a breakout that fires with momentum already rolling over is far more likely to fail.
A low-volume poke through resistance is a warning, not a signal.
How to Identify a Valid Ascending Triangle
A valid pattern passes a structural checklist. The top trendline must be horizontal across at least two to three touches, the bottom trendline must slope upward across at least two touches, and price must fill the triangle side to side with distinct peaks and valleys.
The trend into the pattern can be any direction.
It is easy to misread a real ascending triangle against a flag or other continuation while it forms.
I discard triangles that are mostly white space, that have fewer than the required touches, or whose upper trendline slopes even slightly. A sloped top makes it a symmetrical triangle, not an ascending one, and the statistics shift with the shape.
Label the pattern by what the trendlines actually do, not by what you want to trade.
How to Trade the Ascending Triangle
You trade the confirmed close above the flat resistance, not the approach to it.
The entry is a close above the top trendline on rising volume, with the option to add on the first retest of the breakout level from above. Buying before the close, on the assumption the ceiling will break, exposes you to the patterns that fail at resistance and roll over.
I wait for the close because the edge lives in the confirmation.
The stop goes below the rising support trendline for a risk-defined trade, since a reclaim of support invalidates the breakout thesis.
I size every entry from that risk distance, never from conviction. The gap from entry to stop decides the position, full stop, and a tighter triangle near the apex gives a smaller, cleaner risk than a wide, sloppy one.
Price Target: The Measure Rule
The standard target is Bulkowski's measure rule. Compute the height from the flat resistance line down to the lowest valley in the pattern, multiply that height by the percentage of breakouts that meet the target, and add the result to the breakout price for an up breakout or subtract it for a down breakout.
Work an example to keep it honest.
Say the flat resistance sits at 100 and the lowest valley in the triangle is at 80, so the height is 20. Applied to a 100 breakout, the measured target projects upward by that scaled height.
I treat the full height as an aggressive extension and the scaled figure as the conservative first goal: aim for the nearer number, scale out, then let a runner ride toward the full projection if the trend keeps going.
The Real Success Rate
Here is where the two breakouts diverge, and the reason direction matters more than any other choice on this pattern.
The up breakout is one of the stronger trades in charting. Bulkowski's study of more than 1,400 trades ranks it 16 of 39 bull-market patterns, with a 17% break-even failure rate, a 43% average rise, and a 70% rate of reaching the target.
The down breakout is the opposite: rank 30 of 36, a 38% break-even failure rate, a 13% average decline, and only a 44% target-hit rate.
I trade the up breakout as a genuine edge and treat the down breakout as something to avoid.
| Statistic (Bulkowski, 1,400+ trades, bull-market) | Up breakout | Down breakout |
|---|---|---|
| Performance rank | 16 of 39 | 30 of 36 |
| Break-even failure rate | 17% | 38% |
| Average rise / decline | 43% | 13% |
| Reaches price target | 70% | 44% |
| Throwback / pullback rate | 64% | 63% |
After an intermediate-term rise of three to six months into the pattern, Bulkowski found up breakouts average an even larger 49% rise. The ascending triangle rewards patience and the right direction; it punishes a short taken against a pattern that barely falls and often reverses.
The Down-Breakout Trap
The down breakout deserves its own warning, because it does not just underperform, it actively traps traders. Bulkowski found that almost half, 46%, of ascending triangles with a downward breakout bust, meaning price reverses and rises an average of 36% instead of continuing down.
Two thirds of those busts are single busts.
I fade or avoid the down breakout for exactly this reason.
A short on the down breakout is fighting a move that has a 38% base failure rate and a 46% bust rate on top of that. Even when it does follow through, the average decline is just 13%.
The risk-reward is poor and the trap rate is high, which is why I treat a downward break on an ascending triangle as a signal to stand aside, not a short.
Ascending vs Descending vs Symmetrical Triangles
The triangle family has three members and the differences change the trade. An ascending triangle has a flat top and rising bottom, and it is the bullish one.
A descending triangle flips that, with a flat bottom and falling top, and it is the bearish one. A symmetrical triangle has two converging trendlines with no clear horizontal, and it is direction-agnostic until the break.
I label the triangle by its trendlines before I pick a side.
A flat top makes it ascending and tilts the odds toward an up breakout; a flat bottom makes it descending and tilts them down; two sloped lines make it symmetrical and demand a wait-and-see. Calling one another quietly flips the statistics against you, the same way a double top reads differently from a head and shoulders even when they look similar.
Common Mistakes
The errors that cost money on the ascending triangle are structural. Drawing a sloped top trendline and calling it ascending is the big one, because that makes it a symmetrical triangle with different odds.
Shorting the down breakout is the next, given its 38% failure and 46% bust rate. Buying before the close, and accepting a half-empty triangle, complete the set.
Each mistake comes from wanting the pattern to be cleaner than it is.
The quieter error is overconfidence in the target. With a 64% throwback rate on up breakouts, expecting price to run straight to the measured move sets you up to give back gains.
I scale out into the first leg and move my stop to break-even once the retest holds, which is how you keep a 43% average rise from turning into a round trip.
Modern Examples
Most pages illustrate triangles with charts from decades ago, which is a tell that they copied the textbook instead of opening a current chart. The structure is easier to trust when you recognise it in recent names.
Large-cap stocks consolidating under a known resistance before earnings or a breakout repeatedly print ascending-triangle structures, though read those as structural analogues rather than cited case studies.
I am deliberately not handing you fabricated entry and exit prices for these.
Precise back-tested trade levels without a verified source are exactly the kind of made-up case study that gets traders hurt. What you can verify is the shape: a flat top, a rising bottom, the required touches, declining volume into the apex, and a volume-backed close above resistance.
Learn the geometry from real recent charts and you start seeing it form in real time, not just in hindsight.