The Pennant Pattern, Defined
A pennant is a short continuation pattern that pauses a sharp move before resuming it: an unusually steep flagpole, a small triangular consolidation between two converging trendlines, then a breakout in the trend's direction. It looks like a compact version of a symmetrical triangle sat on top of a pole.
I treat the pennant as a low-edge setup that demands strict risk control, and the statistics explain why.
The shape is popular because it is dramatic, the steep pole followed by a tidy little triangle, but dramatic and reliable are not the same thing. A pennant without a genuine flagpole is not a pennant, and most apparent pennants on an intraday chart are noise.
The pattern earns its keep only when the pole is real and the follow-through confirms.
Anatomy of the Pattern
A pennant has two parts and both must be present. The flagpole is an unusually steep, multi-day price run that sets up the pattern; without it, you do not have a pennant.
The pennant itself is a brief consolidation between two converging trendlines that resolves in the trend's direction, usually within three weeks.
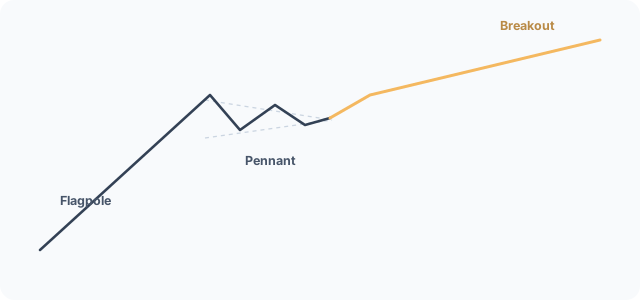
I only count the pennant when it is tight and brief.
Bulkowski is explicit that a tight pennant outperforms a loose one, and that anything beyond three weeks is no longer a pennant but a symmetrical triangle or a wedge. I discard any consolidation that drags on longer than that, because it has stopped being a pause and started being a range with different statistics.
Pennant vs Flag
Pennants and flags are cousins and they get confused constantly, which matters because the shape changes the odds. A flag consolidates between two parallel trendlines, giving it a rectangular look.
A pennant consolidates between two converging trendlines, giving it a small triangular look. Both follow a flagpole and both resolve in the trend's direction.
The pennant is the weaker of the two.
I label the consolidation by what its trendlines actually do before I size the move, the same way I would separate a flag from an ascending triangle. A parallel channel is a flag with a 44% failure rate; a converging triangle is a pennant with a 54% failure rate.
Calling one the other quietly shifts already-poor odds further against you.
The Volume Signature
Volume on a pennant should mirror the flagpole and then go quiet. The pole forms on high volume as the move accelerates, and the pennant itself dries up as participants pause.
Bulkowski found volume trends downward 86% of the time through the formation, even more reliably than on a flag.
The drying volume is what tells you the consolidation is a pause rather than a top.
If volume holds high through the triangle, buyers and sellers are still slugging it out and the setup is more likely a distribution range than a rest break. I want to see the volume visibly contract into the apex before I trust the breakout, because a pennant that never goes quiet is a market that has not agreed on a direction yet.
The breakout should reverse that quiet.
A valid breakout lands on a volume spike, because that is fresh participation joining the resuming move. I cross-check the breakout against momentum before committing, since a breakout with momentum confirming is far more trustworthy than price alone.
A low-volume poke out of the pennant is the setup most likely to fail.
How to Identify a Valid Pennant
A valid pennant passes a short checklist. There must be a genuine flagpole, an unusually steep move that precedes the consolidation.
The pennant must be brief, under three weeks, and bounded by converging trendlines. Volume should collapse through the pennant before spiking on the breakout.
It is easy to misread a real pennant against a double top or other pattern while it forms, because the small consolidation can look like a top.
I discard consolidations with no flagpole behind them, any triangle that stretches beyond three weeks, and any pennant that slopes in the direction of the prevailing trend. Bulkowski notes that last point hurts performance: a pennant drifting with the trend, rather than against it, is a warning the move is already exhausted.
How to Trade the Pennant
You trade the breakout in the trend's direction, not the consolidation.
The entry is a close outside the pennant's trendline on rising volume, with the option to add on the first retest of the breakout level. Entering inside the pennant, before the breakout, leaves you exposed to the 54% of pennants that fail at break-even.
I wait for the close, because the statistics say the move has to confirm before it is worth owning.
The stop goes just outside the opposite side of the pennant for a risk-defined trade.
I size every entry from that risk distance, never from conviction. The gap from entry to stop decides the position, full stop, and a tight pennant near the apex gives a smaller, cleaner risk than a wide, sloppy one.
Put numbers on it and the discipline is obvious.
If a stock breaks out of a pennant at 100 and your stop sits at 97, that is a 3-point risk. Risking 1% of a 10,000 account means 100, which sizes to roughly 33 shares, and the conservative measure-rule target near 102 pays just 2 points.
That thin reward-to-risk is the honest shape of a pennant trade, which is exactly why I keep the risk tight and refuse to reach for the midpoint projection.
Price Target: The Measure Rule and the Midpoint Myth
The textbook target is the midpoint rule, and it is the part of the pennant mythology I most want traders to question. The rule says the pennant marks the halfway point of the move, so you measure the flagpole height and project the same distance from the breakout.
It sounds clean, and it is the version most of the SERP repeats.
The reality is that the midpoint rule barely works.
Bulkowski's half-staff data shows the post-pennant trend reaches or exceeds the inbound trend only 30% of the time. The average post-pennant rise is about 14% over roughly 10 days, against an average inbound rise of 19% over 11 days.
In other words, seven times in ten the second leg is shorter than the first, which makes the midpoint projection an aggressive hope, not a plan.
I use Bulkowski's measure rule instead, the conservative one.
Take the height of the inbound swing, multiply it by the percentage of pennants that meet the target, and add that scaled figure to the bottom of the pennant for an up breakout. Aim for that nearer number first, scale out, then treat any extension toward the full pole-height projection as upside optionality rather than a guarantee.
The Real Success Rate
Here is the part the SERP glosses over, and the reason a pennant is not the reliable signal most traders assume.
The pennant is even weaker than the flag. Bulkowski's study of more than 1,600 trades puts the break-even failure rate at 54% in both directions, with an average move of just 7% up and 6% down, and only 35% of up-breakout pennants and 32% of down-breakout pennants reaching their target.
More than half of all pennants fail at break-even, and I trade them as low-edge swings that have to be managed tightly, not as reliable signals.
One caveat keeps those small numbers honest.
| Statistic (Bulkowski, Pennants, bull-market, 1,600+ trades) | Up breakout | Down breakout |
|---|---|---|
| Break-even failure rate | 54% | 54% |
| Average rise / decline | 7% | 6% |
| Reaches price target | 35% | 32% |
| Breakouts upward | 57% of the time | 43% of the time |
| Volume trends downward | 86% of the time | |
Bulkowski measures pennant performance on the short-term price swing rather than the move to the ultimate high or low, which is why the averages look small and why pennants are not ranked alongside the bigger patterns. They are short-term trades, and the 7% average is a swing figure, not a full-move figure.
Even so, the 54% failure rate is the headline: a pennant is a low-edge setup that demands tight risk control, not a reliable signal.
Common Mistakes
The errors that cost money on pennants are structural. Trading a pennant with no real flagpole is the big one, because a consolidation without a pole has no momentum to continue.
Trusting the midpoint projection is the next, given it works only 30% of the time. Holding beyond three weeks, and chasing a low-volume breakout, complete the set.
Each mistake comes from wanting the pattern to be there.
The quieter error is overconfidence in the target. With a 54% failure rate and a 6 to 7% average move, expecting a pennant to run to the full pole-height projection sets you up to give back gains.
I scale out into the first leg and move my stop to break-even once the retest holds, which is how you keep a small average winner from turning into a round trip.
Modern Examples
Most pages illustrate pennants with charts from decades ago, which is a tell that they copied the textbook instead of opening a current chart. The structure is easier to trust when you recognise it in recent names.
High-momentum stocks through 2023 and 2024 repeatedly printed flagpole-and-triangle structures before their next legs, though read those as structural analogues rather than cited case studies.
I am deliberately not handing you fabricated entry and exit prices for these.
Precise back-tested trade levels without a verified source are exactly the kind of made-up case study that gets traders hurt. What you can verify is the shape: a genuine steep flagpole, a short converging-triangle consolidation under three weeks, volume collapsing into the pennant, and a volume-backed breakout.
Learn the geometry from real recent charts and you start seeing it form in real time, not just in hindsight.