The Cup and Handle Pattern, Defined
The cup and handle is a bullish continuation pattern in which price rounds out a U-shaped base, drifts down in a smaller pullback, then breaks above the prior peak on rising volume. William O'Neil first defined it in his 1988 book How to Make Money in Stocks, and it remains one of the most-watched chart setups in equities.
I treat it as a pause-and-refresh structure rather than a reversal.
The cup is the long digestion of the prior uptrend, where supply gets absorbed and weak holders exit. The handle is the last shake-out before the trend resumes.
Get the structure right and the breakout does most of the work for you; get it wrong and you are buying a lookalike that statistics say will retrace.
Who Defined It: William O'Neil and the 1988 Original
Most pages on this pattern skip the attribution, which is a mistake because the original rules still anchor what counts as valid. William J.
O'Neil, founder of Investor's Business Daily, defined the cup and handle in How to Make Money in Stocks (McGraw-Hill, 1988). He built it into his CAN SLIM methodology as the timing component: find fundamentally strong leaders, then buy the exact pivot point as they break out of a sound base.
That pivot point, the buy point, is the top of the cup just before the handle forms.
O'Neil's insistence on volume confirmation, a shallow handle, and a rounded cup (never a sharp V) comes straight from that original work. I lean on those criteria because they filter out the lazy lookalikes that fail.
The methodology has been refined for decades, but the structural tests have not really changed, which tells you something about how well they hold up.
Anatomy of the Pattern
The pattern has three parts, and each has a structural test it must pass. The cup is a rounded decline and recovery that retraces roughly 15% to 33% of the prior advance.
It should shape a U, not a sharp V, because the rounding is what tells you real basing happened. The handle is a smaller pullback that drifts downward, and the neckline is the horizontal resistance at the cup's prior high where the breakout triggers.
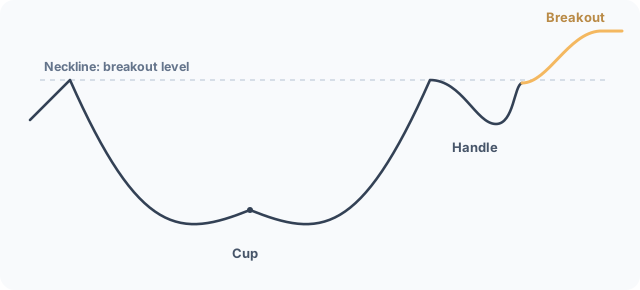
Handle depth is the detail most traders fudge. StockCharts ChartSchool and O'Neil both put the handle at up to one-third of the cup's advance, while Wikipedia (citing O'Neil) gives a looser 30-50% range.
I use the tighter one-third ceiling as my validity line, because a handle deeper than that usually means the base is breaking down rather than resting.
Timing matters too.
The cup typically runs one to six months and the handle one to four weeks, per StockCharts ChartSchool. Bulkowski's tested range is wider, seven to 65 weeks for the cup, but the popular one-to-six-month window is where the cleanest, most tradable setups live.
Anything shorter than a few weeks is usually noise dressed up as a base.
The Volume Signature
Volume is the tell that separates a real base from a chart that just looks like one. The left side of the cup should form on higher volume as sellers exhaust.
The right side should recover on lighter volume, and the handle should contract quietly. Then the breakout lands on a spike.
The specific bar I use comes from tastytrade's guidance: breakout volume should run at least 40-50% above the security's average daily volume. Treat that as broker guidance rather than hard academic research.
In my experience, though, a low-volume breakout fails far more often than a high-volume one, because thin volume means there is no real demand behind the move.
Pair the breakout candle with a momentum read and you have a real-time filter.
I cross-check thrust against MACD momentum confirmation rather than trusting price alone. If price breaks out but momentum is already rolling over, that divergence is a warning the breakout may not hold.
How to Identify a Valid Cup and Handle
A valid pattern passes a checklist, not a vibe. The cup must be rounded and shallow, typically 15-33% deep.
The handle must stay in the upper half of the cup and retrace no more than about one-third of the advance. The breakout must fire on volume.
It is easy to confuse this setup with adjacent structures. A rounded cup that completes and holds its high looks a lot like a double bottom early in its formation; the difference is that the cup is one smooth U with a handle, while the double bottom is two distinct lows separated by a peak.
Knowing which one you are actually in changes where you enter.
Invalid formations are worth naming because they look close enough to trap you. A V-shaped cup with no basing is the classic one.
So is a handle that drops below the cup's midline. A handle that grinds sideways for weeks, or a breakout on dead volume, round out the set I see fail most often.
Each of them breaks O'Neil's original structural rules, which is exactly why those rules exist.
How to Trade the Cup and Handle
You trade the breakout, not the handle.
The entry is a close above the neckline (the prior cup high) on that 40-50% volume surge, with the option to add on the first retest of the breakout level. Buying inside the handle is the most common way traders get chopped up, because the handle exists specifically to shake people out before the real move.
The stop-loss goes below the handle low for a tight, risk-defined trade. For a swing that can weather the throwback, use the cup low instead.
I size every cup-and-handle entry from that risk distance, never from conviction: the distance from your entry to your stop decides how many shares you hold, full stop.
That risk-first sizing is even more decisive when you add leverage to a breakout trade.
On leveraged instruments like crypto perpetuals, the stop distance is the only thing standing between you and a liquidation, so the same cup-and-handle entry logic has to be paired with tighter, more disciplined sizing than a cash stock trade.
Price Target: The Measured Move Method
The standard target is the measured move: take the depth of the cup, measured from the left-side high down to the cup low, and add it to the breakout price. If a stock bottoms at 120 after peaking at 150, the cup depth is 30.
The breakout near 150 therefore projects to roughly 180. tastytrade uses this same $150 / $120 / $30 framework, and it is the cleanest version of the rule on the SERP.
I run a conservative variant alongside it.
Project the height of the handle upward from the breakout instead. That gives a nearer, more reliable first target to scale into, which matters because most breakouts do not run straight to the measured move.
For aggressive extensions, some traders tag the 1.618 Fibonacci projection of the cup depth. I treat that as upside optionality rather than a plan: hit the conservative target first, bank some, then let a runner ride toward the measured move.
The Real Success and Failure Rate
Here is where the SERP is uniformly wrong, and it is the one section I insist traders read before they size a position.
At least half a dozen ranking pages repeat a 95% success rate and attribute it to Bulkowski. That number is a misread.
Bulkowski's actual statistic, published on ThePatternSite and drawn from 913 perfect bull-market trades, is a 5% break-even failure rate, meaning 95% of patterns moved at least 5% past the breakout. That is not the same thing as a 95% win rate, and conflating the two is how traders get overconfident.
The numbers that actually matter tell a more honest story, summarised in Bulkowski's data below.
| Statistic (Bulkowski, 913-trade bull-market sample) | Figure |
|---|---|
| Break-even failure rate | 5% |
| Average rise after breakout | 54% |
| Reaches the price target | 61% |
| Throwback rate (retraces after breakout) | 62% |
| Rank among bull-market chart patterns | 3 of 39 |
Bulkowski ranks the pattern 3 out of 39 bull-market chart patterns, which is genuinely strong. Notice the gap between the 61% target-hit rate and the 62% throwback rate: most winners revisit the breakout level before continuing, and that single fact should change how you manage the trade.
His updated work is even more useful.
In a study of 300 patterns running from 1990 through March 2024, Bulkowski found that 47% of the time the stock retraces significantly after an upward breakout, and 23% rise no more than 15% before dropping. The honest read is a high-quality pattern with a real whipsaw problem, not a near-guaranteed win.
Plan for the throwback and the pattern stays tradable; assume the 95% myth and you will be the one providing the exit liquidity.
Common Mistakes
The errors that cost money are almost all structural. Buying inside the handle instead of waiting for the breakout is the big one.
Ignoring the volume spike is the next. Accepting a V-shaped cup as a base, or letting the handle drop below the cup's midline, complete the set of recurring mistakes.
Each one is a direct violation of O'Neil's original criteria.
The quieter mistake is overconfidence in the target. Because the throwback rate sits at 62%, expecting a clean run to the measured move sets you up to give back gains.
I scale out into strength and move my stop to break-even once the breakout retest holds, which is how you survive a pattern that statistically likes to retrace. Watch how price behaves around gap breakouts for a sense of how thin early follow-through can really be.
Inverted Cup and Handle Pattern
The inverted cup and handle is the bearish twin of this setup. It is an upside-down rounded top followed by a small upward drift, then a breakdown.
Same geometry, opposite implication. Bulkowski tracks it separately on ThePatternSite, and its statistical profile is meaningfully weaker than the bullish original.
I treat the inverse as a short or a sell signal on a breakdown below the inverted neckline, with the same volume check applied in reverse: you want high volume on the breakdown, not a slow bleed. It is rarer and less reliable, so size it smaller than you would the bullish setup.
Cup and Handle in Crypto and Forex
The pattern is market-agnostic. It works anywhere human psychology produces consolidation and breakout behaviour, which is everywhere there is real liquidity.
In crypto, the higher volatility means the cup depth percentages run wider and the handles are sharper, but the underlying structure holds. Bitcoin and large-cap altcoins print recognisable cup-and-handle bases on daily and weekly charts, and the breakout dynamics are the same as in equities.
I have watched the same base form on Bitcoin and large-cap altcoins; crypto's structural volatility just makes volume and stop placement even more decisive than they are in stocks. The breakout logic translates directly to leveraged crypto instruments, and the same pattern shows up on perpetual-futures charts where funding costs and liquidation cascades amplify the moves.
The setup does not change; the risk parameters do.
Modern Examples
Most ranking pages still illustrate this pattern with stale charts from the 1990s and 2000s, which is a tell that they copied each other rather than looking at a screen. The structure is easier to trust when you can recognise the names.
Nvidia's 2023 base ahead of its AI-driven run is the textbook recent example. Apple's multi-year consolidations and AMD's accumulation structures show the same rounded-base-then-handle archetype on a longer timeframe.
I am deliberately not handing you fabricated entry and exit prices for these.
Precise back-tested trade levels without a verified source are exactly the kind of made-up case study that gets traders hurt. What you can verify is the shape: a rounded recovery to a prior high, a shallow pullback on light volume, then a volume-backed breakout.
Learn the geometry from real recent charts, and you will start seeing it form in real time rather than only in retrospect.