The Wedge Pattern, Defined
A wedge is a chart pattern formed by two converging trendlines sloping in the same direction. A rising wedge slopes upward and is bearish, because the lower line rises faster than the upper and the range narrows into a point; a falling wedge slopes downward and is bullish, the mirror image.
I treat the wedge as a pattern with a famous reputation and a poor record, and the statistics explain why.
The shape signals that one side of the market is losing momentum even as price drifts its way, which is why wedges are reversal patterns. The catch, and the part most pages bury, is that the most popular wedge trade, shorting a rising wedge breaking down, is one of the worst-performing setups in charting.
Anatomy of the Pattern
A wedge has two trendlines and both slope the same way while they converge. In a rising wedge, the lower support line rises faster than the upper resistance line, so the two meet at an apex as price makes higher highs and higher lows in a narrowing range.
In a falling wedge the geometry is inverted, with both lines sloping down.
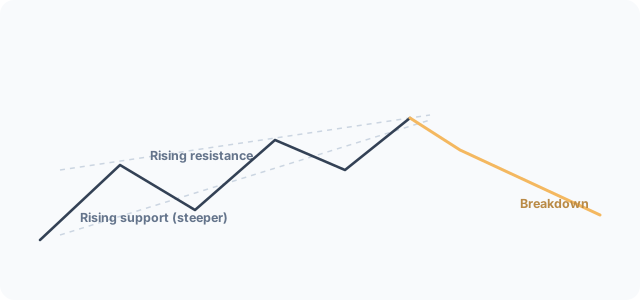
I only count the wedge when it is properly built.
Bulkowski requires price to touch each trendline at least five times, three on one and two on the other, so the shape is a real narrowing range rather than a couple of random touches. A half-built wedge with a single peak and a single trough is two lines you drew, not a pattern.
Rising Wedge vs Falling Wedge
The two wedges are mirror images and they signal opposite outcomes. A rising wedge forms after an uptrend, with both trendlines sloping up, and it resolves bearishly as the buyers lose steam.
A falling wedge forms after a downtrend, with both lines sloping down, and it resolves bullishly as the sellers exhaust.
The rising wedge gets the attention, and it deserves the scrutiny.
I read the direction from the slope before I consider a trade: up-sloping and converging is a rising wedge to watch for a break down, down-sloping and converging is a falling wedge to watch for a break up. Calling one the other flips an already-poor set of odds the wrong way, the same care I take separating a triangle from a wedge.
The falling wedge deserves its own patience.
It forms after a downtrend as both trendlines slope down and converge, with selling pressure fading into the apex, and it resolves upward more often than not. Bulkowski tracks it as a separate pattern with its own statistics, so I do not carry the rising wedge's grim down-breakout numbers across.
Treat the falling wedge on its own merits: wait for the close above the upper line, confirm with volume, and let the mirror image play out.
The Volume Signature
Volume on a wedge should decline as the pattern tightens, then spike on the breakout. Bulkowski found volume trends downward 79% of the time until the breakout, which reflects the narrowing range and the waning conviction behind the drift.
The breakout needs to reverse that quiet.
A valid breakout lands on a volume surge, because that is the participation needed to carry the move. I cross-check the break against momentum before committing, since a breakout with momentum confirming is far more trustworthy than price alone.
A low-volume poke through a trendline is a warning, not a signal.
How to Identify a Valid Wedge
A valid wedge passes a structural checklist. The two trendlines must slope the same direction and converge, with at least three touches on one and two on the other.
The pattern must run at least three weeks, because anything shorter is a pennant, not a wedge. Volume should decline through the formation.
It is easy to misread a real wedge against a pennant or a flag while it forms.
I discard wedges with fewer than the required touches, any pattern shorter than three weeks, and any two trendlines that do not actually converge. A wedge that runs sideways is a rectangle, a wedge with one flat line is a triangle, and each carries its own statistics.
Label the pattern by what the trendlines do, not by what you want to trade.
How to Trade the Wedge
You trade the confirmed close outside a trendline, not the approach to it.
The entry is a close beyond the relevant trendline on rising volume, with the option to add on the first retest of the breakout level. Bulkowski explicitly advises waiting for that close before taking a position, because acting early on a narrowing range exposes you to the wedges that never resolve.
I wait for the close because the edge lives in the confirmation.
The stop goes just outside the opposite trendline for a risk-defined trade.
I size every entry from that risk distance, never from conviction. The gap from entry to stop decides the position, full stop, and a wide wedge gives a larger but cleaner structure than a narrow one, which Bulkowski notes performs worse on up breakouts.
Put numbers on a rising-wedge short and the discipline is obvious.
If price closes below the lower line at 105 and your stop sits at 110, that is a 5-point risk. Risking 1% of a 10,000 account means 100, which sizes to roughly 20 shares, and the conservative measure-rule target near 97 pays about 8 points.
That is a respectable reward-to-risk on paper, but remember the down breakout fails 51% of the time, so I take that size only on a clean, volume-backed close.
Price Target: The Measure Rule
The standard target is Bulkowski's measure rule. Compute the height from the highest peak in the pattern down to the lowest valley, multiply that height by the percentage of wedges that meet the target, and subtract the result from the breakout price for a down breakout or add it for an up breakout.
Work an example to keep it honest.
Say a rising wedge peaks at 120 with its lowest valley at 100, so the height is 20. Applied to a 105 down-breakout price, the measured target projects downward by that scaled height.
I treat the full height as an aggressive extension and the scaled figure as the conservative first goal: aim for the nearer number, scale out, then let a runner ride only if the trend keeps extending.
The Real Success Rate
Here is the part the SERP glosses over, and the reason I want traders reading it before they short a rising wedge.
The rising wedge is one of the worst-performing patterns in charting, especially when it breaks down. Bulkowski's study of more than 1,400 trades ranks the down breakout dead last, 36 of 36, with a 51% break-even failure rate, a 9% average decline, and only a 32% rate of meeting the target.
Bulkowski calls these "unacceptably high failure rates and small post breakout declines."
I treat the rising-wedge down breakout as a low-edge short, not the reliable signal it is billed as.
| Statistic (Bulkowski, Rising Wedge, 1,400+ trades, bull-market) | Up breakout | Down breakout |
|---|---|---|
| Performance rank | 32 of 39 | 36 of 36 (last) |
| Break-even failure rate | 19% | 51% |
| Average rise / decline | 38% | 9% |
| Reaches price target | 63% | 32% |
| Throwback / pullback rate | 72% | 72% |
The irony is that the up breakout from a rising wedge performs better than the down breakout, ranking 32 of 39 with a 38% average rise, even though an up break from a rising wedge is the rarer, counter-intuitive outcome. The wedge that breaks in the "expected" direction is the worse trade, which is the single most useful fact about this pattern.
Common Mistakes
The errors that cost money on wedges are structural. Shorting the rising wedge before the down-breakout close is the big one, given its 51% failure rate.
Treating a sub-three-week pattern as a wedge is the next, since that is a pennant. Counting too few touches, and chasing a low-volume breakout, complete the set.
Each mistake comes from wanting the pattern to resolve cleanly.
The quieter error is overconfidence in the target. With a 72% pullback rate on down breakouts, expecting price to run straight to the measured move sets you up to give back gains.
I scale out into the first leg and move my stop to break-even once the retest holds, which is how you keep a 9% average decline from turning into a round trip against you.
Wedge vs Pennant vs Triangle
Wedges, pennants, and triangles are all converging-trendline patterns, and the differences change the trade. A wedge runs at least three weeks with both trendlines sloping the same direction.
A pennant is the same converging shape but shorter than three weeks and sat on a flagpole. A triangle has one flat or oppositely-sloping trendline rather than two parallel-direction ones.
I separate them by duration and slope before I size the move.
The same way a double top reads differently from a head and shoulders, a three-week rising wedge reads differently from a one-week pennant on a pole. Get the label right or the statistics you are implicitly betting on will not match the pattern on your chart.
Modern Examples
Most pages illustrate wedges with charts from decades ago, which is a tell that they copied the textbook instead of opening a current chart. The structure is easier to trust when you recognise it in recent names.
Index and large-cap charts through 2022 and 2023 repeatedly printed rising-wedge structures near tops before breaking lower, though read those as structural analogues rather than cited case studies.
I am deliberately not handing you fabricated entry and exit prices for these.
Precise back-tested trade levels without a verified source are exactly the kind of made-up case study that gets traders hurt. What you can verify is the shape: two same-direction converging trendlines, the required touches, at least three weeks of duration, declining volume, and a volume-backed close outside a trendline.
Learn the geometry from real recent charts and you start seeing it form in real time, not just in hindsight.