The Double Top Pattern, Defined
The double top is a bearish reversal pattern that forms after an uptrend: two peaks at roughly the same height separated by a valley, then a breakdown below that valley low. It is the mirror image of the double bottom, and it is the reversal pattern most retail traders learn first.
I treat it as a warning shot, not a signal.
The two peaks say buyers tried twice to push price higher and failed both times. That is useful information, but it only becomes a trade when price closes below the valley between them.
Most of the damage traders do to themselves happens in the gap between spotting the shape and waiting for that confirmation.
Anatomy of the Pattern
The pattern has three parts and each has a test. The first peak caps an uptrend, the valley between the two peaks sets the confirmation level, and the second peak rallies back to roughly the same height as the first before rolling over.
The breakdown below the valley low is what turns the shape into a live short.
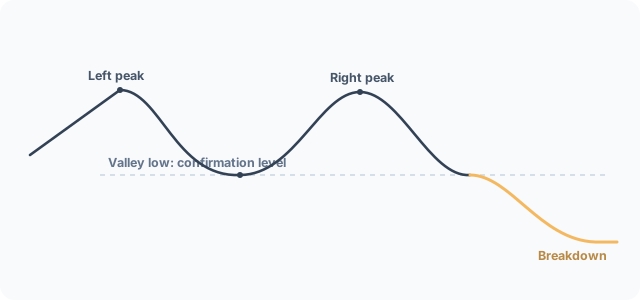
The peaks do not need to be identical, but they should be close.
Bulkowski puts the usual price variation between the two peaks at less than 3%, and the valley should drop at least 10% from the peaks. Two tops a mile apart in price are not a double top; they are two unrelated highs.
I only count the pattern when the peaks sit close enough in height and time to be the same fight.
Adam and Eve: Why Peak Shape Matters
Here is a detail most pages skip, and it changes the numbers. Thomas Bulkowski splits double tops into four types by the shape of each peak, because the shape changes how the pattern performs.
An Adam peak is narrow and pointed, often a one-day spike; an Eve peak is rounded and wider, broadening over its height.
That gives four combinations.
Adam and Adam, Adam and Eve, Eve and Adam, and Eve and Eve each have their own statistics. I cite the Adam and Adam variant in this guide because the two sharp, matched peaks are the classic double top most traders picture, and it carries the largest sample in Bulkowski's work.
If your peaks are rounded, you are looking at an Eve variant and the profile shifts.
The Volume Signature
Volume tells you whether the second peak had any conviction behind it. Bulkowski found volume is usually higher on the left peak than the right, and it trends downward across the pattern.
The second peak forming on lighter volume is the first clue the buyers are exhausted.
The breakdown should reverse that decline.
The close below the valley low ought to land on a volume spike, because that is real selling pressure finally winning. I cross-check the break against momentum before committing, since a breakdown with momentum already rolling over is a far cleaner signal than price alone.
How to Identify a Valid Double Top
A valid pattern passes a checklist, not a feeling. There must be a prior uptrend to reverse.
The two peaks should sit within about 3% of each other in price, the valley between them should drop at least 10%, and the peaks should form several weeks apart rather than days. Volume should be heavier on the first peak.
It is easy to misread a real double top against a fellow bearish reversal while it forms.
The head and shoulders adds a third, lower peak to confirm distribution; the double top stops at two. I discard peaks more than a few percent apart in price, any valley shallower than 10%, and any two highs days apart on an intraday chart, because each fails the structural logic the pattern depends on.
Confirmation: The Rule Everyone Breaks
This is the section I want traders reading before they size a position, because the double top's reputation is built on a mistake.
A double top is not a double top until price closes below the valley between the two peaks. Bulkowski is blunt about what happens if you act earlier: unconfirmed twin peaks fail 60% of the time, with price continuing higher instead of reversing.
Shorting the second peak, before the valley gives way, is the single most common way traders get squeezed on this setup.
The confirmed pattern is a different animal.
Once price closes below the valley low, the same study puts the break-even failure rate at 25%, less than half the unconfirmed rate. That gap between 60% and 25% is the entire edge, and it is available to anyone willing to wait for the close.
How to Trade the Double Top
You trade the confirmed break of the valley, not the second peak.
The entry is a close below the valley low on rising volume, with the option to short the retest once price pulls back up toward the valley from below. Entering on the second peak, before confirmation, is gambling on the 60% failure side of the trade.
I never do it, and the statistics say you should not either.
The stop goes above the higher of the two peaks for a risk-defined trade, since a reclaim of the peaks invalidates the reversal thesis.
I size every entry from that risk distance, never from conviction. The gap from your entry to your stop decides the position size, full stop, and the same risk-first logic applies wherever you take a leveraged reversal trade.
Price Target: The Measure Rule
The standard target is Bulkowski's measure rule. Compute the height from the highest peak down to the lowest valley between the two peaks, multiply that height by the percentage of patterns that meet the target, and subtract the result from the breakout price at the valley low.
The breakout price is simply the valley low itself.
Work an example to make it concrete.
Say the peaks sit at 120 and the valley low at 105, so the height is 15. Applied to a 105 breakout, the measured target projects downward by that scaled height.
I treat the full peak-to-valley height as an aggressive extension and the scaled figure as the conservative first target: aim for the nearer number, scale out, then let a runner ride toward the full projection.
The Real Success Rate
Here is the part the SERP oversells, and the reason a double top is not the reliable signal most traders assume.
The double top is one of the most famous reversals in trading and one of the least reliable. Bulkowski's study of 1,114 perfect Adam and Adam trades ranks it 19 out of 36 bull-market chart patterns, with a 25% break-even failure rate, a 64% rate of reaching the price target, and an average decline of just 15% after the breakdown.
I trade it as a middling edge that rewards patience, not as a reliable signal.
The number that should change how you trade it is the pullback rate.
| Statistic (Bulkowski, 1,114-trade Adam and Adam bull-market sample) | Figure |
|---|---|
| Performance rank (bull-market patterns) | 19 of 36 |
| Break-even failure rate (confirmed) | 25% |
| Average decline after breakdown | 15% |
| Reaches the price target | 64% |
| Pullback rate (retraces after breakdown) | 64% |
| Unconfirmed twin peaks that fail | 60% |
That 64% pullback rate means most confirmed breakdowns retrace into the valley low before continuing lower. It is why short sellers get stopped on the retest: they expect a clean slide and catch a rally instead.
Plan for the pullback and the pattern stays tradable; expect a straight line down and the 25% that fail outright will be the least of your worries.
Common Mistakes
The errors that cost money are structural. Shorting the second peak instead of waiting for the valley to break is the big one, and Bulkowski quantifies it at a 60% failure rate.
Treating two unrelated highs as a double top is the next, followed by counting a shallow valley, and ignoring the volume decline.
Each mistake traces back to impatience or pattern-forcing.
The quieter error is overconfidence in the target. With a 64% pullback rate, expecting price to run straight to the measured move sets you up to give back gains.
I scale out into the first leg down and move my stop to break-even once the retest holds, which is how you survive a pattern that statistically loves to retrace. The same retest dynamic is why a cup and handle breakout rewards patience just as much.
Double Top vs Double Bottom
The double top and the double bottom are the same pattern flipped upside down, and they are the pair a trader is most likely to meet together. The double top is a bearish reversal at the top of an uptrend; the double bottom is a bullish reversal at the end of a downtrend, with two troughs at roughly the same low separated by a peak.
The confirmation logic is identical in both.
A double bottom confirms on a close above the peak between the two troughs, just as a double top confirms on a close below the valley. I reach for whichever sits at the right end of a trend: the double top after a run-up, the double bottom after a slide.
Neither is a trade until its middle is broken.
Modern Examples
Most pages still illustrate this pattern with charts from decades ago, which is a tell that they copied the textbook instead of opening a current chart. The structure is easier to trust when you recognise it from names you know.
Major index tops and large-cap stock peaks through 2022 repeatedly printed twin-peak structures before their larger declines, though read those as structural analogues rather than cited case studies.
I am deliberately not handing you fabricated entry and exit prices for these.
Precise back-tested trade levels without a verified source are exactly the kind of made-up case study that gets traders hurt. What you can verify is the shape: an uptrend, two peaks near the same height, a valley at least 10% deep, declining volume into the second peak, and a close below the valley.
Learn the geometry from real recent charts and you start seeing it form in real time, not just in hindsight.