The Head and Shoulders Pattern, Defined
The head and shoulders is a bearish reversal pattern that forms after an uptrend: three peaks with the middle one highest, joined by a support line called the neckline, then a breakdown below it. Traders have watched it for the better part of a century, and it remains the most recognisable top in technical analysis.
I treat it as a distribution signature rather than a magic signal.
The prior uptrend is the setup, the three peaks are smart money distributing into retail, and the neckline break is the moment supply takes control. Recognise the shape and you catch the transition; trust the shape blindly and the statistics will punish you.
Anatomy of the Pattern
The pattern has four moving parts and each has a structural test. The left shoulder is the first peak, the head is the highest peak that follows it, and the right shoulder is a third peak roughly equal to the left.
The neckline is the trendline connecting the two troughs between the shoulders and the head.
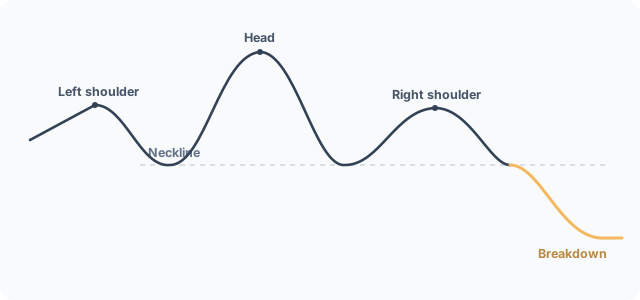
The neckline is the part most people get wrong.
It is not always horizontal. It can slope up or down, and the slope changes where the breakout triggers.
An up-sloping neckline breaks earlier; a down-sloping neckline is already weaker and breaks later, off the right-shoulder armpit. I only draw the neckline once both troughs are in place, because connecting a real low to a guessed low invents a breakout level that does not exist.
The Volume Signature
Volume is the tell that separates a genuine head and shoulders from three random peaks. Thomas Bulkowski found that volume is highest on the left shoulder followed by the head, and it trends downward through the pattern 61% of the time.
The right shoulder should form on lighter volume than the left.
The breakdown changes that picture.
The neckline break should land on a volume spike, because that is real selling pressure finally overwhelming the bid. A low-volume breakdown is a warning, not a signal.
I cross-check thrust against momentum before committing, because a breakdown with rolling-over momentum is far more trustworthy than price alone.
There is a subtler tell inside the head itself.
Although the head prints the highest peak, Bulkowski found its volume typically falls short of the left shoulder's, which is the first clue the uptrend is losing steam. When the right shoulder then forms on the lightest volume of the three, the distribution thesis is intact: buyers are stepping in with less and less conviction at each successive high.
How to Identify a Valid Head and Shoulders
A valid pattern passes a checklist, not a vibe. There must be a prior uptrend to reverse.
The head must be the highest of the three peaks. The right shoulder should sit roughly level with the left, and volume should decline from shoulder to shoulder before spiking on the break.
It is easy to confuse a real head and shoulders with a fellow reversal structure while it forms; the difference is the third peak. A double top has two peaks; the head and shoulders adds a lower third peak to confirm the distribution.
Invalid formations are worth naming. A flat top where the head barely exceeds the shoulders is not a head and shoulders.
Neither is a right shoulder that climbs well above the left, nor a pattern with no uptrend behind it. Each of those fails the structural logic the pattern depends on.
Context also changes the odds, and Bulkowski quantifies it.
A short- to intermediate-term rise leading into the pattern produces the best post-breakdown performance, and a high-velocity run-up tends to be followed by a larger decline. Patterns that form within a third of the yearly high perform slightly worse.
I weight a head and shoulders more after a sharp, recent rally than after a slow, drawn-out grind, because the statistics say the former breaks harder.
How to Trade the Head and Shoulders
You trade the neckline break, not the right shoulder.
The entry is a close below the neckline on rising volume, with the option to short the retest once price pulls back up to the neckline from below. Shorting inside the right shoulder, before the neckline gives way, is the classic way traders get squeezed, because the right shoulder is still a higher-timeframe uptrend until the break confirms.
The stop goes above the right shoulder for a risk-defined trade, since a reclaim of the right-shoulder peak invalidates the distribution thesis. I size every entry from that risk distance, never from conviction: the gap from entry to stop decides the position size, full stop.
Put numbers on it and the discipline is obvious.
If the neckline sits at 100 and your stop above the right shoulder is 106, that is a 6-point risk. Risking 1% of a 10,000 account means 100, which sizes to roughly 16 shares, and the measured target near 90 pays 10 points for a better-than 1.5-to-1 reward-to-risk before the 68% pullback probability even enters the math.
Those are the only numbers that should decide the trade.
Price Target: The Measure Rule
The standard target is Bulkowski's measure rule. Compute the height from the head peak down to the neckline directly below it, multiply that height by the percentage of patterns that meet the target (51% in his study), and subtract the result from the breakout price.
The breakout price is where price crosses an up-sloping neckline, or the right-shoulder armpit when the neckline slopes down.
Work an example to make it concrete.
Say the head peaks at 120 with the neckline at 100, so the head height is 20. Half of that (applying the 51% meet-target factor) is roughly 10, subtracted from a 100 breakout gives a target near 90.
I treat the full head-height projection (down to 80 here) as an aggressive extension, not the plan: aim for the conservative measured target first, scale out, then let a runner ride.
The Real Success Rate
Here is the part the SERP oversells, and the reason I want traders reading it before they size a position.
The head and shoulders is the most famous reversal in charting, and it is only mediocre. Bulkowski's study of more than 2,800 perfect trades ranks it 9 out of 36 bull-market chart patterns, with a 19% break-even failure rate, a 51% rate of reaching the price target, and an average decline of just 16% after the breakdown.
That is a real edge, but it is not the reliable signal most traders assume.
The number that should change how you trade it is the pullback rate.
| Statistic (Bulkowski, 2,800+ trade bull-market sample) | Figure |
|---|---|
| Performance rank (bull-market patterns) | 9 of 36 |
| Break-even failure rate | 19% |
| Average decline after breakdown | 16% |
| Reaches the price target | 51% |
| Pullback rate (retraces after breakdown) | 68% |
That 68% pullback rate is the number to act on. Most breakdowns retrace into the neckline before continuing lower, which is exactly why short sellers get stopped out on the retest: they expect a clean slide and instead catch a rally that tags their stop before the move resumes.
Plan for the pullback and the pattern stays tradable; expect a straight line down and the 19% that fail outright will be the least of your worries.
Common Mistakes
The errors that cost money are structural. Drawing the neckline before both troughs exist is the big one.
Shorting the right shoulder instead of waiting for the neckline break is the next. Ignoring the volume decline, and misreading a down-sloping neckline, complete the recurring set.
Each mistake traces back to impatience.
The quieter error is overconfidence in the target. With a 68% pullback rate, expecting price to run straight to the measured move sets you up to give back gains.
I scale out into the first leg down and move my stop to break-even once the retest holds, which is how you survive a pattern that statistically loves to retrace. Watch how price behaves around a cup and handle breakout for the mirror image of how thin early follow-through can be.
Inverse Head and Shoulders
The inverse head and shoulders is the bullish twin of this setup. It is a mirror image: three troughs after a downtrend with the middle one lowest, a neckline across the highs, then a breakout above it.
Same geometry, opposite implication.
I trade the inverse the same way in reverse.
The entry is a close above the neckline on rising volume, the stop sits below the right-shoulder trough, and the target projects up by the head height. Bulkowski tracks the inverse as a separate pattern with its own statistics, so I do not carry the bearish numbers across; treat it on its own merits and size it the same disciplined way.
Head and Shoulders vs Double Top
Both are bearish reversal patterns, and they are the two a trader is most likely to confuse. The double top is two peaks at roughly the same height with a trough between them.
The head and shoulders is three peaks with the middle one higher and a defined neckline.
The difference matters for confidence.
The head and shoulders shows a fuller process of distribution across three peaks, which is a richer signal that buyers are exhausting. The double top is simpler and often faster.
Neither is strictly more profitable, but the head and shoulders gives you a clearer neckline to trade against. I reach for the head and shoulders when I want a defined line to short against, and the double top when I want a faster, blunter read.
The mirror logic is the same reason a double bottom reads differently from an inverse head and shoulders at a market low.
Modern Examples
Most pages still illustrate this pattern with charts from decades ago, which is a tell that they copied the textbook rather than opening a current chart. The structure is easier to trust when you recognise the name.
On a recent index scale, the S&P 500's 2022 top is widely read as a multi-month head and shoulders that preceded a sharp leg lower, though read it as a structural analogue, not a cited case study.
I am deliberately not handing you fabricated entry and exit prices for these.
Precise back-tested trade levels without a verified source are the kind of made-up case study that gets traders hurt. What you can verify is the shape: an uptrend, a left shoulder, a higher head, a right shoulder near the left, a declining neckline, and a volume-backed break.
Learn the geometry from real recent charts and you start seeing it form in real time, not just in the rear-view mirror.