If you are looking at forex for the first time, it can feel like some secret club where everyone talks in codes and acronyms.
It is not. It is just a market.
A huge one, yes. The Bank for International Settlements estimates that total currency trading is now around 9 to 10 trillion US dollars per day worldwide.
But once you understand the building blocks, forex is just buying one currency and selling another, based on a plan.
What Is Forex?
Forex, or FX, means “foreign exchange”. It is the global marketplace where currencies are traded.
When you see a rate for EUR/USD in your banking app, you are looking at a small window into the foreign exchange market .
A few key points, so you have the big picture:
- It is a decentralised market. There is no single forex exchange like the NYSE. Trading happens over the counter through banks, brokers and electronic platforms.
- It runs almost 24 hours a day, from Sunday evening to Friday evening, because as Asia closes, Europe opens, then the US.
-
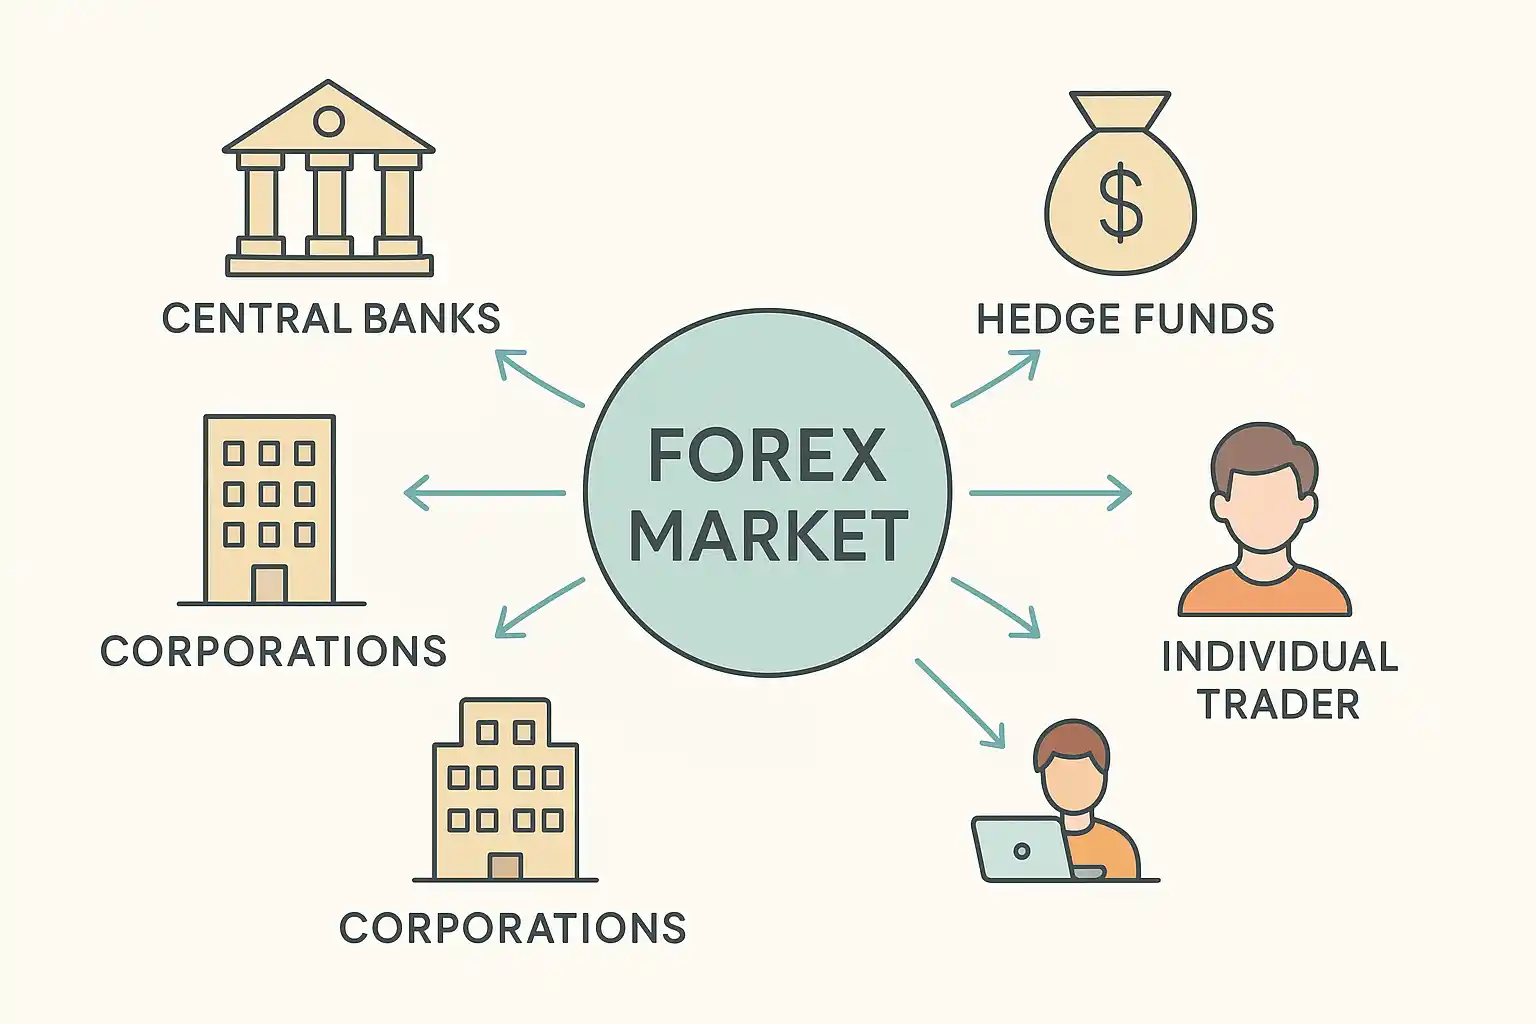
It is used by:
- Central banks and governments
- Big commercial and investment banks
- Corporations that import and export
- Hedge funds and asset managers
- And, at the very end of that chain, retail traders like you
If you are a beginner, one helpful way to think about forex is this:
The “serious money” is mostly using forex to move capital and hedge risk, and traders like you are swimming in the same pool, trying to profit from price changes.
So you want to respect that, not fight it.
Why The Forex Market Exists
Forex is not here for traders first. It exists because the real world needs it.
- A US company buying machines from Germany needs to turn USD into EUR.
- A Japanese fund buying US Treasuries needs to turn JPY into USD.
- Tourists flying from London to New York need dollars, then back to pounds when they get home.
All of that creates demand for currency exchange.
On top of this “real economy” demand, you have speculation . Traders and investors:
- Take views on interest rates and central bank policy
- Hedge positions in other markets
- Short one currency and buy another to profit if they are right
If you are reading this guide, you are probably in that last group, or thinking about it.
Currency Pairs, Quotes, Pips, Lots And Leverage
This is the foundation. If you get this clear, the rest of forex will feel much more manageable.
Currency Codes And Pairs
Each currency has a three letter code, like:
- USD for US dollar
- EUR for euro
- JPY for Japanese yen
- GBP for British pound
- AUD for Australian dollar
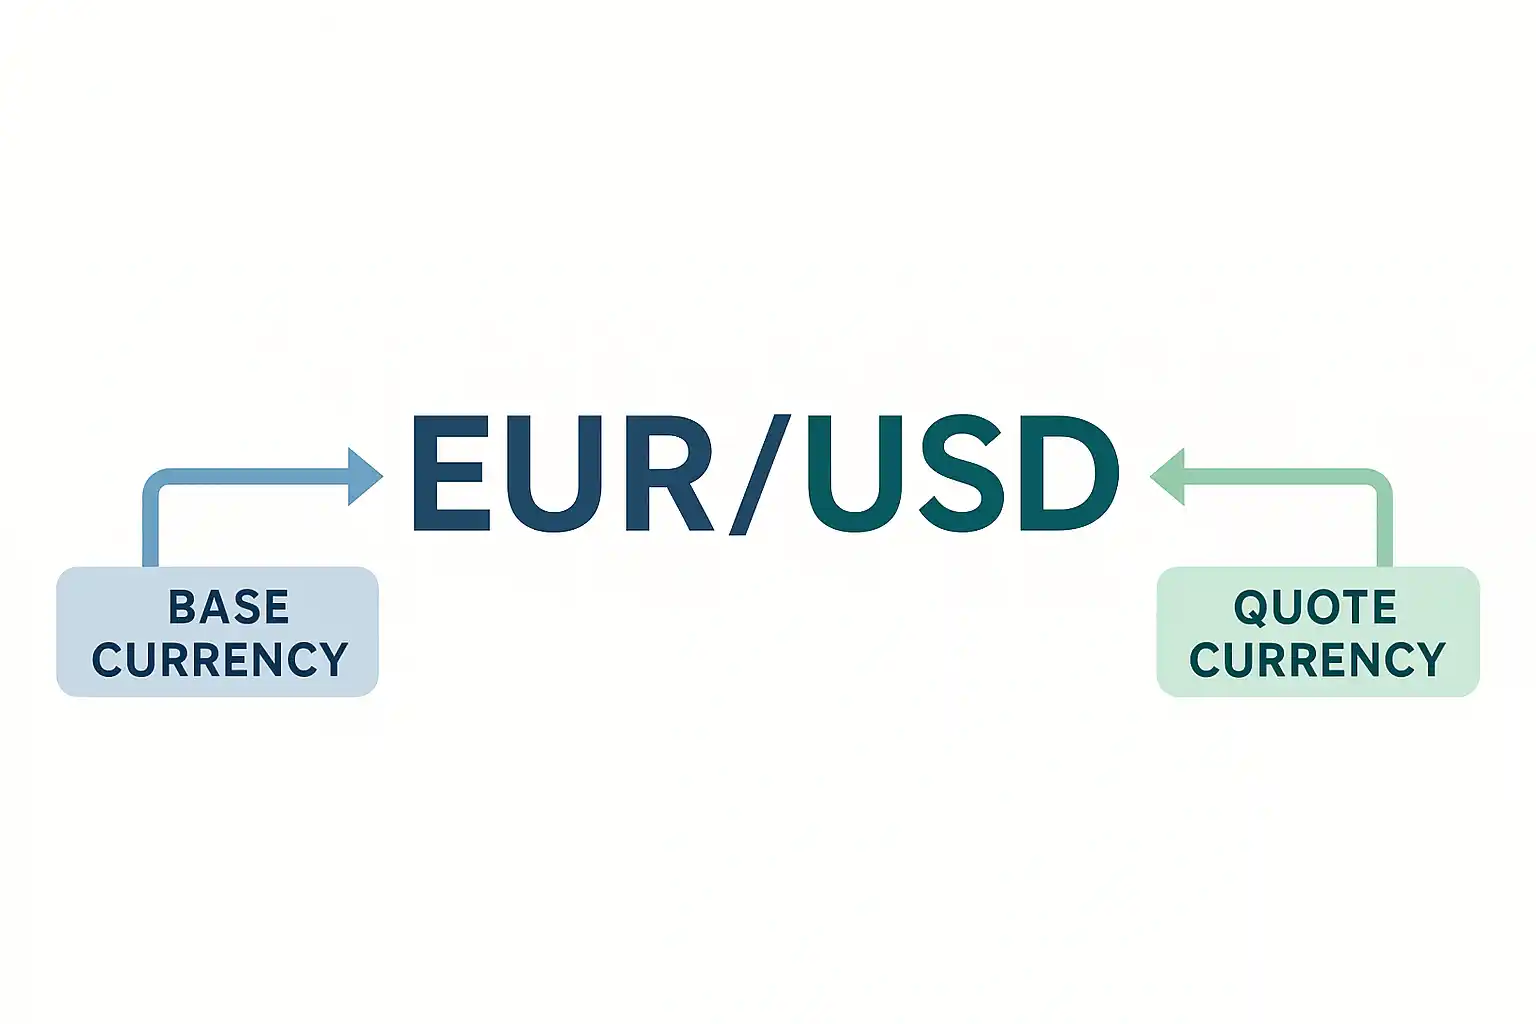
Forex always trades forex pairs , for example EUR/USD or USD/JPY.
In a pair:
- The first currency is the base
- The second currency is the quote
So if EUR/USD is 1.1000, that means 1 euro costs 1.10 US dollars. Simple as that. ( Investopedia )
You will often hear:
- Majors - pairs that include USD and a major economy, like EUR/USD, GBP/USD, USD/JPY
- Minors (crosses) - pairs that do not include USD, like EUR/GBP or AUD/NZD
- Exotics - a major currency paired with an emerging market currency, like USD/TRY
As a beginner, you are usually better off sticking with the majors. They tend to have tighter spreads and more liquidity.
How To Read A Forex Quote
Take this quote:
EUR/USD 1.0998 / 1.1001
Two prices:
- Bid 1.0998 - this is the price you can sell at
- Ask 1.1001 - this is the price you can buy at
The difference is the spread :
- Spread = 1.1001 − 1.0998 = 0.0003
That is 0.3 pips on a 4 decimal pair.
The spread is a real cost to you. If you buy at 1.1001 and price does not move, you are already in a small unrealised loss because you could only sell at 1.0998.
To see what that spread costs in dollars for your exact lot size, use the forex spread cost calculator .
What Is A Pip?
A pip is the basic unit of movement in forex.
-
On most pairs, one pip is the fourth decimal place
- EUR/USD 1.1000 to 1.1001 = 1 pip
-
On JPY pairs, one pip is the second decimal
- USD/JPY 150.10 to 150.11 = 1 pip ( Investopedia )
Some brokers quote extra decimals. Those smaller moves are often called “pipettes”, but as a beginner, focus on normal pips.
Lot Sizes And Position Size
Forex positions are often measured in lots . Use the forex lot size calculator to translate risk into lots:
- 1 standard lot = 100,000 units of the base currency
- 1 mini lot = 10,000 units
- 1 micro lot = 1,000 units

The lot size affects how much money each pip is worth. For pair-specific numbers, use the pip value calculator .
On a typical USD quote pair:
- 1 standard lot is roughly 10 USD per pip
- 1 mini lot is roughly 1 USD per pip
- 1 micro lot is roughly 0.10 USD per pip
So if you are trading 0.10 lots (one mini lot) of EUR/USD and price moves 20 pips in your favour, that is about 20 USD.
This is why small lot sizes are your friend at the beginning. It keeps the dollar swings under control while you learn.
Leverage, Margin And Margin Calls
Leverage is what makes forex exciting and dangerous at the same time.
If a broker gives you 30:1 leverage on EUR/USD:
- With 1,000 USD in your account, you can control up to 30,000 USD of position
To open a position, the broker will hold some of your balance as margin . Think of margin as a deposit, not a fee.
Basic idea:
- You open a trade
- Broker sets aside some of your account as used margin
- The rest is free margin , and it rises or falls as your trade moves
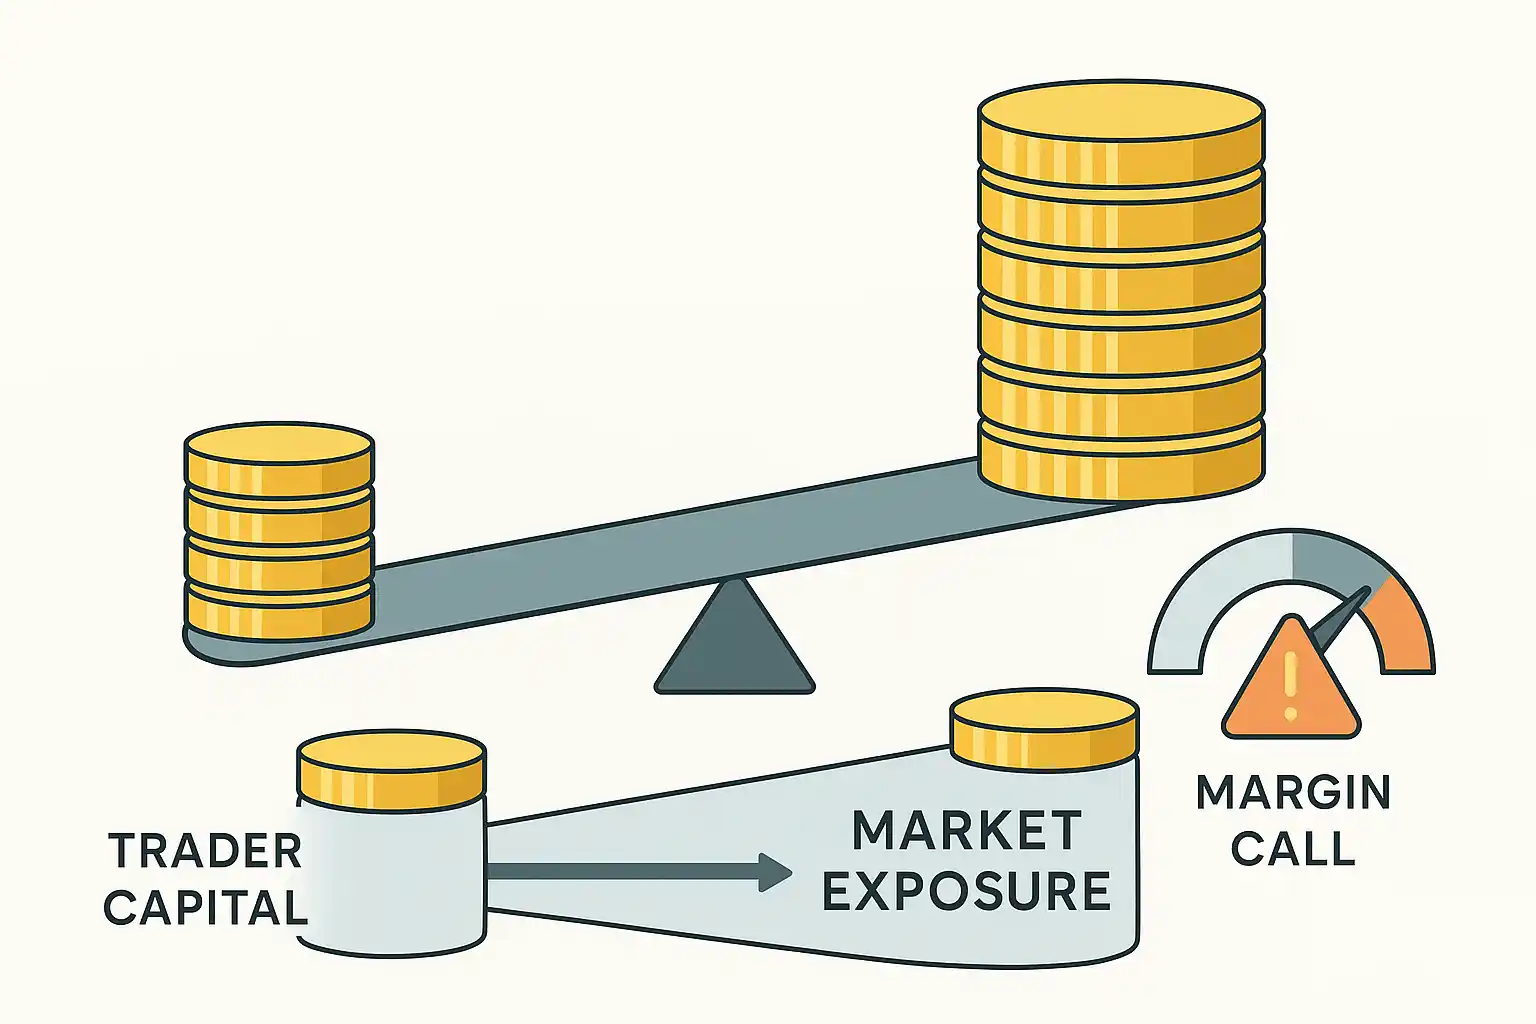
If market moves against you hard and your equity (account balance plus P&L) drops too low, you can hit a margin call or stop out . The broker can start closing trades so your account does not go negative.
In Europe and the UK, regulators like ESMA capped retail leverage at around 30:1 on major forex pairs and require very clear risk warnings, because most retail CFD and forex accounts lose money. ( Esma )
If you are a new trader, the real rule is simple:
Treat leverage with respect, or it will blow you up.
You will see offers of 200:1, 500:1 from offshore brokers. You really do not need that kind of leverage to learn.
How To Start Trading Forex, Step By Step
Let's be practical now. If you are a beginner, here is a clean path.
Step 1 - Learn The Basics And Be Honest About Risk
Before you worry about strategies, make peace with one fact:
Forex is high risk. There are no guaranteed profits, and most people lose.
Regulators in Europe found that roughly 74 to 89 percent of retail CFD accounts lose money. ( Esma )
So if you are going to trade, do it with money you can afford to lose and with the mindset of a student, not a gambler.
If you enjoy structured lessons, the free School of Pipsology is a good extra resource for basics.
Step 2 - Choose A Regulated Forex Broker
You will trade through a broker or a trading platform that connects you to the market.
Key things to look for:
- Regulation in a serious jurisdiction, like FCA (UK), ESMA region, CFTC/NFA (US), ASIC (Australia)
- Segregated client funds , clear policies on deposits and withdrawals
- Transparent costs, spreads, commissions and overnight financing
- Reasonable leverage for your region, not crazy offshore leverage as a main selling point
A dedicated guide like how to choose a forex broker can go through detailed checklists, but even just checking the regulator's public register for the broker's license number is a smart step.
If a platform is unregulated, promises fixed monthly returns, or only takes crypto deposits, treat that as a red flag and walk away. The CFTC and other regulators have been warning about rising online forex scams for years.
Step 3 - Open A Demo Account
A demo account lets you trade with virtual money using real or near real market prices. This is where you learn to operate the platform and test basic ideas without risking cash.
On demo you should:
- Place market orders and pending orders
- Add and move stop losses and take profits
- Watch how your balance, equity, margin, and free margin change
- Try simple trades on one or two pairs
If you can not follow a plan on demo, real money will not magically fix that. It usually makes it worse.
Step 4 - Learn Your Trading Platform
Most forex traders use something like MetaTrader 4 or 5, cTrader, or a broker's own web platform.
Whatever you use, you should feel comfortable with:
- Opening and closing trades
- Modifying orders
- Using charts and adding basic indicators
- Checking your exposure and open risk
If you are a beginner, do not obsess about fancy indicators yet. Focus on knowing exactly what happens when you press buy or sell and where your stop is.
Step 5 - Build A Simple Trading Plan
A trading plan is just a written set of rules for:
- What pairs you trade
- What timeframes you use
- What conditions make you enter
- Where you put your stop loss
- How much you risk per trade
- When you walk away for the day
You can base this on simple forex trading strategies like trend following or range trading.
If you are a beginner, keep it extremely simple. One or two setups. One or two timeframes. One or two pairs. You want something you can test and measure, not a messy mix of ideas.
Step 6 - Go Live, But Small
Once you have:
- A basic plan
- Some demo experience
- A regulated broker you trust
Then you can open a small live account and trade micro or mini lots.
The goal with your first live account is not to get rich. It is to:
- Learn how it feels when real money is on the line
- Practice following your plan when emotions kick in
- Prove to yourself you can stick to risk limits
Think of it as paying tuition.
How A Forex Trade Actually Works
Let's run through a trade from start to finish so you can see the moving parts.
Long And Short
In forex, every trade involves buying one currency and selling another.
- If you go long EUR/USD, you are buying euros and selling dollars. You want EUR to strengthen against USD.
- If you go short EUR/USD, you are selling euros and buying dollars. You want EUR to weaken against USD. ( Investopedia )
There is no “short restriction” like you sometimes see in stocks. Going short is completely normal here.
Order Types
You do not always need to buy or sell instantly.
Basic order types:
- Market order - buys or sells right now at the best available price
- Limit order - sets a price where you are willing to buy below market, or sell above market
-
Stop order
- Stop loss closes a position to cap loss
- Stop entry opens a trade only if price breaks through a level
You will use stop losses constantly. They are your safety net when you are wrong. And you will be wrong plenty. Everyone is.
A Simple Trade Example
Imagine this:
- Account balance: 1,000 USD
- Broker leverage on majors: 30:1
- You trade EUR/USD
You decide:
- Buy 0.10 lots (a mini lot, 10,000 units) at 1.1000
- Place your stop loss at 1.0950 (50 pips)
- Place your take profit at 1.1100 (100 pips)
On 0.10 lots of EUR/USD:
- Pip value is about 1 USD per pip
- 50 pip stop means you risk about 50 USD
- That is 5 percent of your account, which is on the high side already for risk management
Two scenarios:
-
Price falls to 1.0950
- Your stop hits
- Loss is about 50 USD, new balance around 950 USD
-
Price rises to 1.1100
- Your take profit hits
- Gain is about 100 USD, new balance around 1,100 USD
What matters here is not the exact numbers but the process:
- You knew your risk before the trade
- You had a defined exit for loss and for profit
- You were not just “seeing what happens”
We will come back to risk per trade in a moment, because that is where most traders slip up.
Forex Market Hours And When To Trade
The forex market is open 24 hours a day on weekdays, but it is not equally active all the time.
Roughly:
- Asian session - Tokyo and Sydney
- European session - London
- US session - New York
If you want these converted to your local time, the forex market hours converter keeps session times and overlaps in sync.
The busiest times tend to be:
- London session
- London and New York overlap
If you are in Europe or the US and you trade major pairs like EUR/USD, GBP/USD, and USD/JPY, you will usually find better liquidity and tighter spreads around those times.
You can still trade in quieter hours, but spreads can widen, and price action can be choppier.
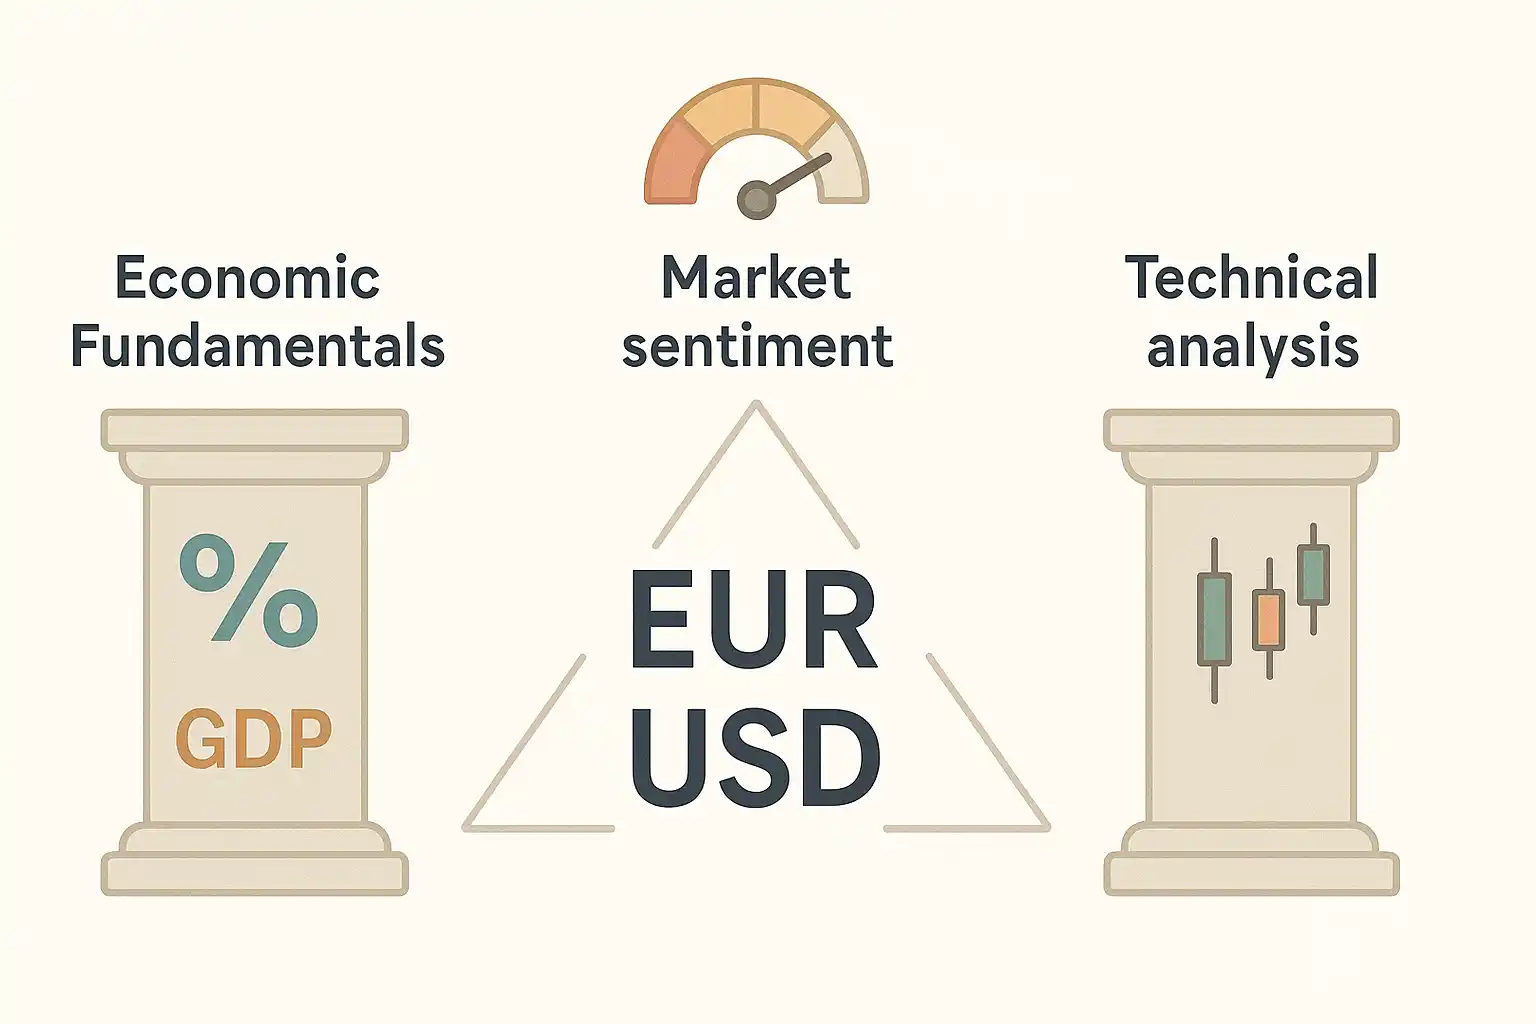
What Moves Forex Prices
Now, what actually makes EUR/USD or GBP/JPY move?
It is a mix of macro economics, market mood and simple supply and demand.
Economic And Political Factors
Big drivers include:
- Interest rates and central bank decisions
- Inflation data
- Growth numbers, like GDP
- Employment and unemployment reports
- Trade balances and current accounts
- Political stability and big geopolitical events
For example, if the US Federal Reserve surprises markets with higher interest rates, that can boost demand for USD, because investors get paid more to hold dollar assets.
As a trader, you can track this stuff using an economic calendar and by following central bank updates. You do not need to become a full economist, but you should know when big events are scheduled, so you are not blindsided.
Central Banks
Central banks like the Fed, ECB, Bank of Japan and Bank of England:
- Set short term interest rates
- Issue guidance about future policy
- Occasionally intervene directly in the FX market when moves get too extreme
Markets hang on their every word, because policy affects expectations about growth, inflation and yields.
If you are a position trader or a swing trader, you can not ignore central bank policy. It is the background music of forex.
Risk Appetite And Market Sentiment
Sometimes price action is less about one country's data and more about global mood.
You will often hear:
- Risk on - investors feel positive and seek higher returns. Money tends to flow into higher yielding or more cyclical currencies like AUD, NZD and some emerging markets.
- Risk off - fear rises, investors seek safety. Flows often favour so called safe haven currencies like USD, JPY and CHF.
So if there is a big shock, you may see:
- Stocks falling
- Junk bond spreads widening
- Safe haven currencies strengthening
Even if there is no fresh data that day.
Technical Factors
A lot of day to day trading is driven by technical analysis :
- Trendlines and channels
- Horizontal support and resistance
- Moving averages
- Indicators like RSI, MACD, Bollinger Bands
Many traders, including me, blend both worlds. We watch the fundamentals for the “why” and use the charts for the “where” and “when”.
If you are a visual person, charts will probably be your main tool. You might start with a basic set of technical analysis basics and build from there.
Liquidity, Volatility And Events
Price moves faster when:
- Liquidity is lower, like during holidays, or right after the market opens for the week
- A big economic report hits, like US nonfarm payrolls or inflation
- A central bank shocks the market
Sharp spikes can cause slippage , where your order fills at a different price than you expected. This is part of the game, especially around news.
If you hate surprises, you may choose to avoid trading right through major announcements.
Forex Trading Styles And Strategies
There is no single right way to perform forex market analysis . There are different styles that fit different personalities.
Trading Styles By Timeframe
A quick overview:
- Scalping - very short term trades, seconds to minutes, many trades per day. High screen time, very sensitive to spreads and execution. Not great for most beginners.
- Day trading - open and close trades within the same day. No overnight positions. Suits people who can watch markets for several hours.
- Swing trading - hold trades for days or weeks. Mix of chart reading and macro view. Often works for people with a day job.
- Position trading - long term trades based mostly on fundamentals. You may hold for months and look at daily or weekly charts.
If you already know your temperament, you can match style to it. If you hate staring at screens, there is no reason to force yourself into scalping.
Common Strategy Types
Here are some broad strategy families that you will see everywhere:
- Trend following - look for markets that are clearly moving up or down and aim to trade in that direction, often using moving averages or higher highs and higher lows as a guide
- Range trading - identify clear support and resistance, buy near the bottom of the range and sell near the top, or vice versa
- Breakout trading - wait for price to build a tight range or consolidation, then trade the break when price bursts out
- News trading - attempt to trade around economic data or central bank events. High risk and can be messy if liquidity dries up
- Carry trade - buy a currency with a higher interest rate and sell one with a lower rate, aiming to earn the interest rate differential over time while managing FX risk.
A Simple Beginner Friendly Strategy
If you are just starting, here is a very stripped down idea, more for practice than for profit:
- Pick one pair, say EUR/USD
- Use the 4 hour chart as your main chart
- Add a 20 period simple moving average and a 50 period simple moving average
- When the 20 is above the 50 and price pulls back near the 50 in an overall uptrend, look for bullish candles and consider a long
- Stop loss below the recent swing low
- Take profit set at roughly twice your stop distance
This is not magic. It is just a way to:
- Trade with the dominant trend
- Have clear rules for entries and exits
- Practice risk management and patience
You would track this in a journal and see if it suits you before risking more money.
Matching Style To You
Ask yourself:
- How many hours can I realistically watch markets?
- Do I like fast decisions or slower ones?
- Can I handle sitting in a trade for days?
Your honest answers should drive your style.
There is no prize for picking the “cool” style. The prize is for picking one you can stick with.
Risk Management And Trading Psychology
This is the boring part that saves your account.
Why Risk Management Is Everything
There is a reason regulators force brokers in Europe to display warnings such as “between 74 and 89 percent of retail investor accounts lose money”. ( Esma )
Most people:
- Risk too much per trade
- Use too much leverage
- Let losers run and cut winners
- Chase losses when they are emotional
Good risk management will not turn a bad strategy into a good one, but bad risk management will absolutely destroy a decent strategy.
Position Sizing And Risk Per Trade
A common guideline is to risk 1 or 2 percent of your account per trade. Many traders who are cautious go lower. The position size calculator turns that rule into a clear share or unit size.
An example:
- Account size: 2,000 USD
- You choose to risk 1 percent per trade → 20 USD
- You find a setup with a 40 pip stop
Roughly:
- Position size = risk amount / (stop in pips x pip value per unit)
On a USD quote pair, for mini and micro lots, you can approximate:
- 0.05 lots (5,000 units) means each pip is about 0.50 USD
- 40 pips x 0.50 USD = 20 USD risk
That fits your 1 percent rule.
You do not have to be exact to 2 decimal places, but you should be conscious of your risk in dollars before you click.
Using Stop Losses And Take Profits
Stop losses are not optional.
You place them:
- At a price that proves your trade idea is wrong
- Not randomly, and not just based on how much you “feel like” losing
Good habits:
- Put the stop in as part of the initial order
- Do not widen it because you hope price will turn
- Only move it closer to lock in profit if you are using a trailing approach
Take profits can be:
- At a fixed reward to risk level, like aiming for 2 times your risk
- At a logical level on the chart, like the next resistance in an uptrend
You do not have to take full profit at once. Some traders scale out, for example taking half at 1R and letting half run with a moved stop.
Avoiding Over Leverage
Let's be blunt.
You can blow a small account in a handful of trades if you:
- Use big lot sizes
- Stack multiple positions
- Trade against volatile events
High leverage plus poor risk control is why so many new traders burn out.
Regulators like ESMA and the FCA capped retail leverage and introduced stricter rules for exactly this reason.
If you are new, using effective leverage of 5:1 or less on your whole account is a good way to stay in the game long enough to learn.
Trading Psychology And Common Pitfalls
You can have the best written plan and still break it once emotions show up.
Common psychological traps:
- Fear of missing out (FOMO) - chasing after moves that already happened
- Revenge trading - jumping back in with bigger size after a loss
- Overconfidence - increasing size aggressively after a few wins
- Paralysis - being afraid to pull the trigger on a valid setup
Simple tools that help:
- Keep a trading journal , including your thoughts and emotions
- Set daily or weekly loss limits where you stop trading after hitting them
- Review your trades on the weekend without the pressure of the live market
Treat yourself as a human, not a robot. You will make mistakes. The key is to learn from them and reduce the size of your worst behaviour.
Platforms, Tools And Resources
You do not need a spaceship level setup, but some tools make life easier.
For sizing, risk limits, and performance tracking, start with the trading tools hub and build your routine around those calculators.
Trading Platforms
Common choices for forex trading platforms include:
- MetaTrader 4 and 5
- cTrader
- TradingView
- Web or mobile platforms built by your broker
Look for:
- Stability and reliability
- Order types you need
- Charting that lets you mark levels and add basic indicators
- A mobile app if you need to monitor trades on the move
You can get more detail from a guide like best forex trading platforms .
Charts And Basic Indicators
At minimum, you will probably use:
- Candlestick patterns
- Horizontal lines to mark support and resistance
- Moving averages for trend context
- An oscillator like RSI to judge overbought or oversold conditions
If you are a beginner, keep the chart clean. Too many indicators can just create confusion. Price itself is the main indicator.
Economic Calendars And News
An economic calendar shows:
- What data releases are coming
- At what time
- What markets they tend to move
You can find calendars on most financial broker sites, on specialist sites like Forex Factory , which is an excellent resource for this.
If you trade intraday, you want to know when those are coming, so you are not surprised by massive candles.
Calculators And Risk Tools
Useful tools:
- Pip value calculators
- Position size calculators
- Margin calculators
These can be built into your broker's platform or available online. Use them. Guessing your size is like guessing the dose of a medication.
Automation, Signals And Copy Trading
You will see offers for:
- Trading robots or “expert advisors”
- Paid signal services
- Copy trading where you mirror another trader's account
Be careful.
Many commercial robots and signal sellers advertise huge returns without proof, or show cherry picked results. Regulators and consumer websites have flagged a lot of these as scams or at least very risky.
If you ever try any automated approach:
- Understand the logic behind it
- Test on demo first
- Start tiny on live
- Make sure you can turn it off quickly
Automation is a tool, not magic.
Advanced Forex Concepts, When You Are Ready
You do not need these on day one, but it helps to know some of the advanced forex trading concepts that are out there.
Algorithmic And Quantitative Trading
Some traders code their strategies so a program takes and manages trades automatically.
That can bring:
- Consistency
- Ability to test historical data
- Speed
But it also needs:
- Good data
- Programming skills
- A solid understanding of market behaviour
If you enjoy coding, this might be a long term direction. If not, you can happily trade manually.
Futures, Options And Other FX Products
Spot forex through a broker is only one way to trade currencies.
Others include:
- FX futures , traded on exchanges like the CME
- FX options , which give the right but not the obligation to buy or sell at a certain price
- Currency ETFs , which give exposure to certain currencies through a stock exchange
These are often used by institutions and corporations to hedge. For an individual, they can be interesting tools once you are comfortable with basic spot trading and you understand the extra complexity.
Carry Trade And Interest Rate Differentials
We touched on carry trades earlier.
In simple terms:
- You buy a higher yielding currency
- You fund it by selling a lower yielding one
- You try to earn the interest differential, while managing exchange rate risk
In practice:
- You receive or pay an overnight “swap” or “rollover” on your positions
- If you are long a currency with higher rates against one with lower rates, you may receive swap
- If you are on the wrong side, you pay
This can add up over time, but carry trades can unwind brutally when market sentiment shifts. So they are not “free money”.
Correlations And Portfolio View
Currencies do not move in complete isolation.
You will often see:
- Positive or negative correlations between certain pairs
- Links between currencies and commodities, like AUD with iron ore, CAD with oil
If you have multiple trades open, checking correlations stops you accidentally taking five trades that all rely on the same basic view.
A guide like currency correlations can help you think about your portfolio as a whole, not just individual trades.
Emerging Markets And Exotic Pairs
Exotic pairs like USD/TRY or USD/ZAR can look tempting, because the moves are big.
But:
- Spreads are wider
- Liquidity can be thin
- Political and event risk is higher
As a beginner, you usually have more than enough action in the major pairs. Exotics can wait.
Benefits And Risks Of Forex Trading
You deserve a straight view of both sides.
Potential Benefits
Some reasons people are drawn to forex:
- High liquidity in major pairs, which usually means tighter spreads and easier trade execution
- 24 hour weekday access , which makes it easier to trade around a day job
- Low minimum trade sizes , with micro and even nano lots on some brokers
- Ability to profit in rising and falling markets , since shorting is built in
- Diversification , adding currency exposure alongside stocks or crypto
- Hedging , if you have income or expenses in other currencies
If you are methodical and patient, forex can be a useful part of your overall financial toolkit.
Real Risks And Downsides
The flip side:
- Leverage risk - small price moves become large P&L swings when you are geared up. This is the big one.
- Volatility and gap risk - news can cause gaps, and stops are not always filled at the exact price in fast markets
- Costs - spreads, commissions, swaps and slippage all add up, especially if you trade a lot
- Psychological stress - seeing your account swing up and down can mess with your sleep and your mood
And we need to repeat this again, because it is important:
Regulators and broker disclosures show that most retail traders lose money in leveraged products like forex and CFDs.
So go in with your eyes open.
Staying Safe, Regulation, Brokers And Scams
The forex market itself is global and largely unregulated at the core level. What is regulated is the broker and the products they offer you.
How Forex Is Regulated
In most countries:
- Authorities either regulate forex and CFD brokers directly
- Or regulate the securities and derivatives products they offer
Examples:
- In the EU, ESMA set rules on leverage, negative balance protection and mandatory risk warnings for CFDs and forex.
- In the UK, the FCA oversees firms offering these products, and regularly warns about mis selling and pushing retail traders into risky “professional” status. ( Financial Times )
- In the US, the CFTC and NFA regulate forex dealers and prosecute unregistered firms.
As a trader, you are not expected to memorise all the rules, but you should know who regulates your broker and what protections you have.
Picking A Safer Forex Broker
A few practical checks:
- Confirm the broker is authorised on the official register of a major regulator
- Check that client funds are held in segregated accounts
- Look at real reviews and see how withdrawals are handled
- Be wary if the main marketing hook is extreme leverage and huge bonuses
A reference like forex broker guide can give you a more detailed checklist.
If a broker is in some unknown offshore jurisdiction with weak oversight, you are taking on extra risk on top of market risk.
Common Forex Scams And Red Flags
Forex attracts scammers, especially on social media.
Watch out for:
- Anyone promising fixed monthly returns or “guaranteed profits”
- Signal services that show only wins, no losing trades
- “Account managers” who want remote access to your platform
- Platforms that take your money easily but make withdrawals slow or impossible
The CFTC, FCA and others have public warning lists for suspicious firms. It is worth checking those if something feels off.
If a pitch relies on rented cars, luxury villas and buzzwords, rather than clear risk disclosure, close the tab.
Protecting Yourself
A few simple habits go a long way:
- Only deposit money you can afford to lose
- Start with small amounts and test withdrawals early
- Keep your platform login and two factor codes safe
- Do not trade on someone else's account, and do not let them trade on yours
If something does go wrong, gather evidence and contact your local regulator or financial ombudsman service as soon as possible.
Getting Started, Your Next Steps
If you are still with me, nice work. Forex is a lot to take in at first.
Here is a simple way you can move forward without overwhelming yourself:
- Re read the basics in this guide until currency pairs, pips, lots and leverage feel familiar
- Pick one or two major pairs to focus on, like EUR/USD or GBP/USD
- Open a demo account with a regulated broker and practice basic trades
- Sketch a very simple trading plan and test it, keeping risk tiny
- Build your knowledge in key areas like forex risk management, trading psychology and strategy development
Treat this as a long term skill, not a quick fix. Many of the best traders I know took years to really find their footing.
If you keep your risk small, stay honest with yourself, and actually enjoy the learning process, forex can be a challenging but interesting market to explore.